
Table of Contents
Curated Careers
Trends and Tidbits:
WTH is Behavioural Analytics?
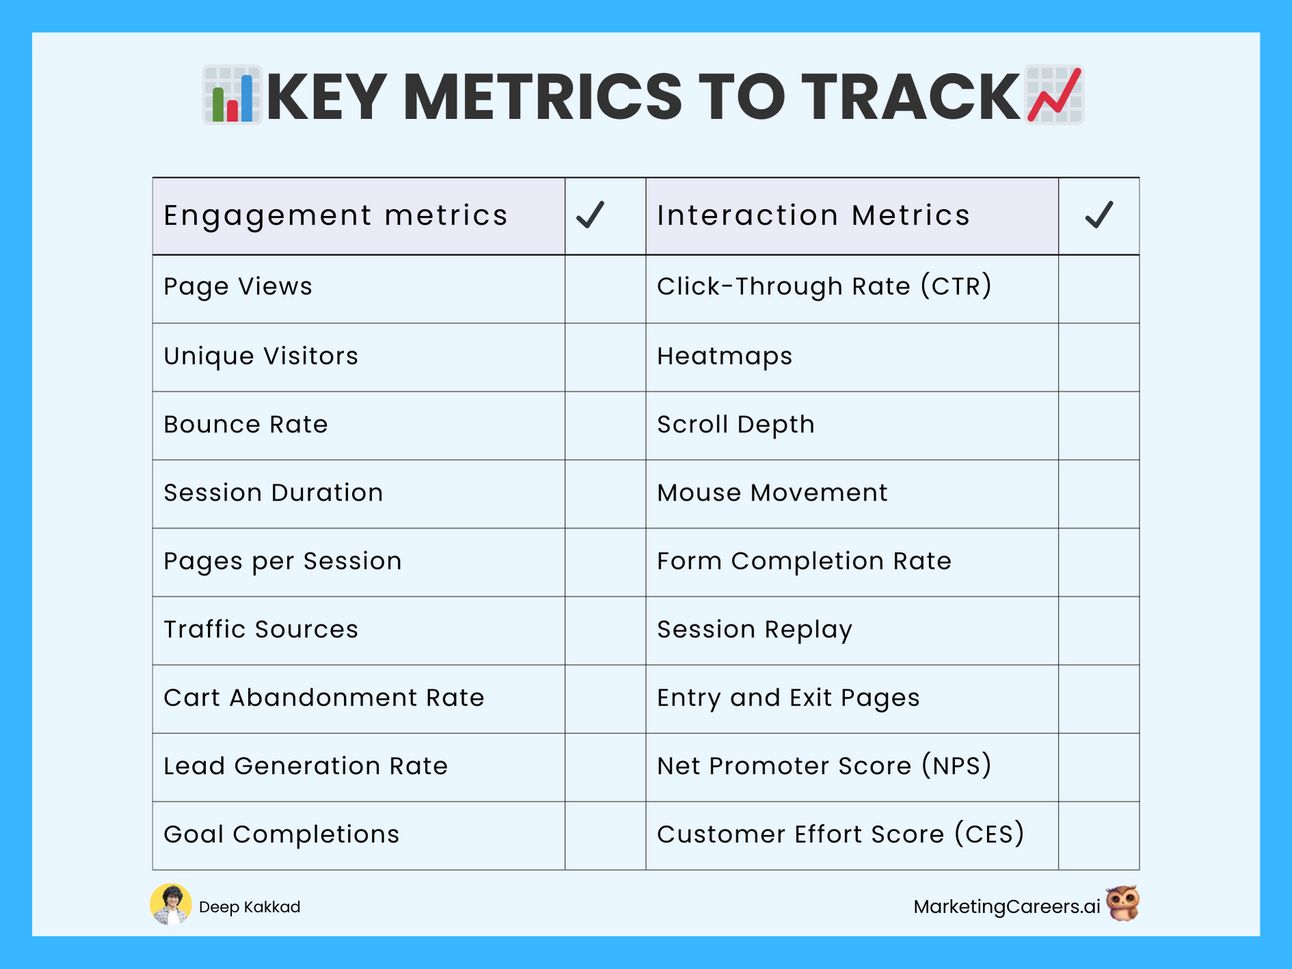
Key metrics to track 📈📊
Customer Journey Map templates📝
AI Arena:
Top AI Updates This Week
If this was forwarded to you, consider joining our community. Subscribe here
Learn AI Strategies worth a Million Dollar in this 3 hour AI Workshop. Join now for $0
Everyone tells you to learn AI but no one tells you where.
We have partnered with GrowthSchool to bring this ChatGTP & AI Workshop to our readers. It is usually $199, but free for you because you are our loyal readers 🎁
This workshop has been taken by 1 Million people across the globe, who have been able to:
Build business that make $10,000 by just using AI tools
Make quick & smarter decisions using AI-led data insights
Write emails, content & more in seconds using AI
Solve complex problems, research 10x faster & save 16 hours every week
You’ll wish you knew about this FREE AI Training sooner (Btw, it’s rated at 9.8/10 ⭐)
💼 Curated Careers 💼
Remote Partnerships Manager at OnTheGoSystems
📍 Full-time, Remote
⚒️ Brief: Be in charge of planning and executing partnership strategies and different campaigns
Marketing Director at Hello Alice
📍 Full-time, Remote
⚒️ Brief: Develop and implement a comprehensive digital marketing strategy, encompassing web, social media, email, SEO/SEM, and other relevant online channels
💎 Trendy Tidbits 💎
➡️ WTH is Behavioural Analytics?

Picture this:
You've just launched a brand-new hair oil.🧴
It promises silky smooth locks in just a few weeks. 🗓️
your product is ready
the website is live
you're eager to see those sales rolling in.
But wait, why isn't anyone clicking "buy now"? 😥
→ Maybe you don’t know their pain points
→ Maybe you don’t recognize the patterns of their behaviour
→ Maybe the reason is: You don’t understand your customers! (ouch!)
~Ok, ok Deep, maybe I’m new to this or I’m missing out on something.
But, How the heck do you understand your customers?
➡️Understand Your Customers✅
1) Understanding your users starts with behavioural analytics.
It is not just about who is buying what.
→ But also we dig deeper into how and why decisions are made.
It involves ordered data collection about how users interact with your website.
To sum it up, the observable user behaviours are—
→ Which web pages do they visit more often?
→ What makes them leave?
→ Which actions lead to conversion?
Once you know the answers to these questions, you can figure out the friction points and optimize user experience accordingly, which we term funnel analysis.
In addition, this gives us a priority list for optimization. In simple words, it tells which pages should be optimized first and what needs to be changed.
2) Later, you can segment the user sets based on—
→ Demography: such as age, gender, income, education, and occupation.
→ Geography: This is important if you have local stores near the users.
→ Device & source: Mobile users may interact differently than laptop users. Also, it is important to engage the traffic coming from different sources (social media, search engines or direct) with suitable responses.
3) Heatmaps and Clickmaps
What are they? Well, these are graphical representation tools depicting how users interact with the nooks and corners of your webpage.
Normally, the red areas indicate a higher interaction as the spectrum converts to the blueish shades, the interaction is lesser.
There are types -
Scroll maps
Click maps
Move maps
Engagement Zone maps
Rage click maps
i) Scroll map - It depicts how deep the users scroll on the webpage.
ii) Clickmaps- They depict the places or elements most clicked on the webpage.
iii) Hover maps- it tracks the mouse movement over the webpage.
But what do we even do with these maps? 🤔
Answer- analysis (and redesign) of the webpage.
→ Place important content (Your USP and CTA, etc) in high-engagement areas.
→ Identify popular links.
→ Find out dead ends: where users click a lot, but it leads to nothing.
→ Track what’s going on behind pop-up forms/ login screens.
Let’s understand how the maps can work magic for you.
Look at the following case study of Canyon Bicycles. (using Hotjar tool)
➡️A Case Study: Canyon Bicycles - Source Hotjar
Meet Sarah, Canyon’s UX team lead.
She uses Hotjar to address the common problem of ‘data without context’.
On using the feedback widget, heatmaps, and session recordings.
Here are the three useful results she pointed out—
Feedback for bug-spotting

Sarah says that the feedback widget on Canyon’s website helps them get real and raw feedback from the users.
This way she can keep improving the information or interaction on the website keeping an eye on the received suggestion or criticism from the widget.
Usability fixes using research and surveys
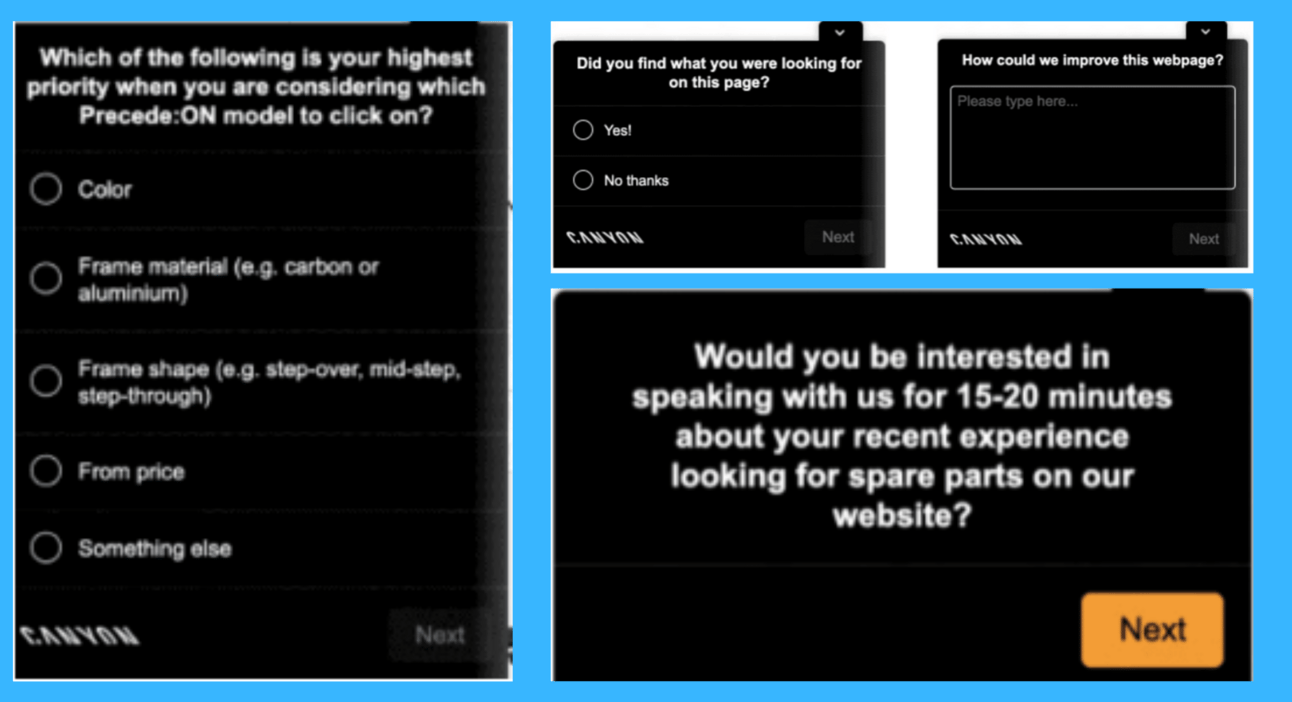
Canyon has multiple survey pop-ups in different parts of the website.
But the twist is: that they show up just to the right users. ( the loyal ones)
This way they are aware of—
→ what are the features most favorite to their users?
→ If the users are satisfied with the content on the page?
→ Are they willing to talk to them and tell their recent experience?
Recordings and heatmaps
For Sarah, these tools are especially useful to “triangulate data from Google Analytics”.
Let’s think of their checkout funnel.
Google Analytics helps track where the users drop off.
But it doesn’t help in the “HOW”
There can be a hundred reasons a user drops off on a webpage.
There come recordings and heat maps into the play!
By clicking view recording for any hotspot, she can watch multiple sessions to mark out the odds.
So that she can connect the quantitative data (Google Analytics) with the qualitative experience (Heatmaps) and infer useful corrections.

4) Session recording-
This tool gives a more qualitative aspect of users’ experience on our website.
And this is how you can access the session recordings on Hotjar.
(You might already think Hotjar is today’s sponsor.Believe me, it’s not😂, it's just that I am familiar with it. Alternatives will work perfectly fine as well)
The filtered recordings can effectively help you to—
→ Understand the user journey clearly - the path they take before converting
→ Find issues missed in other analytics like moments of frustration, confusion or bugs on the webpage.
5) Surveys & competitor analysis
As I always say, surveys are the goldmine of analytics.📈
You may take onsite surveys, popups or push emails.
These manually written feedbacks can help beyond any other behavioural analytics.
Because, users write their pain points, give suggestions and also point out usability issues clearly in the surveys, that you might miss in analytics.
➡️Tools to use for Behavioral Analytics
Here are some of the best behavioural analytics tools —
Hotjar: Heatmaps, session recordings, and feedback tools.
Microsoft Clarity: Free open-source alternative.
Mixpanel: Detailed reports on user behaviour across platforms.
Crazy Egg: Known for its heatmap and A/B testing capabilities.
FullStory: Combines quantitative and qualitative data to provide a comprehensive view of user interactions in real time.

➡️Customer Journey Map Templates
Here is an editable visual map for customer journey tracking-
If you are in the ideation stage now, here’s a reference for the structure—
→ Customer Journey map for ideation (PDF)
Well, that’s a wrap on understanding your customers.
Cheers on completing step 1 of becoming a champion in Conversion Rate Optimization(CRO). 🎬
Here’s a trophy for you 🏆
If you didn’t check out the last issue, where I explained wth is CVR and how the process of CRO works, click here. (Downloadable checklist inside)
Look out for the next issue, where we discuss how to craft a killer landing page.
In other thoughts…
Write discounted prices on the right — Source Ariyh
When offering a moderate discount (~30%), write the discounted price to the right of the original price (e.g. Was $10.00, Now for only $7.00), not the left (e.g. Now $7.00, Was $10.00).
Compared to when it’s written on the left, people will perceive the discount as bigger and will be more likely to buy the item.
→ But for very high (85% or more) or low (under ~10%) discounts this backfires. In these cases, keep the discounted price on the left of the original price.
🧠Reason- It’s easier for us to calculate the difference when the larger number appears before the smaller number, as this matches the typical format for subtracting numbers.
→ But when a discount is a round figure, like 10%, we can easily calculate it regardless of the order the prices are listed.
🤖 AI Arena 🤖
Top AI Updates in Marketing
Meta’s Video Vision AI - Meta has created a new type of AI technology that can analyze videos, segment anything. This new AI system can quickly identify and outline different objects in a video, like a person, a tree, or a car.
Canva’s AI Acquisition - Canva has acquired the generative AI startup Leonardo AI. It helps AI-powered image creation across industries like fashion, advertising, and architecture.
GrowthSchool - Learn the top 1% AI hacks, tools & strategies to grow your business & career. This FREE 3-hour workshop (usually $199 but free for the first 100) teaches you all of it & more. 1 Million+ people love it! Join here.
Create Your AI Clones - Meta is launching a new tool called AI Studio that will allow anyone in the US to create AI versions of themselves to use on Instagram and across Meta's apps.

Thanks,
Deep Kakkad, your marketer friend.


